Floating Menu
The floating menu defines most of the functionalities available for graph manipulations. This section describes all the options available in the order they appear:
Modes
- Arrows: Defines whether or not to add arrows to the ends of edges indicating reaction directionality. Besides the visual component, removing arrows from the map will allow the force-directing to render faster, which might be desirable for larger graphs.
- Tooltips: If this option is turned on, hovering over nodes will display a tooltip with all the data related to that node.
- Hide Rxns: Hide reaction nodes. This option makes reaction nodes invisible, but they can still be clicked, dragged, and rearranged.
- Move Labels: By default, node labels are not clickable in order to make the rearranging of node easier. By turning this option on, labels can be dragged and repositioned. The label will then remain in the same position relative to the node once the node is dragged. Toggle this functionality with the shortcut key m.
- Link Strain: Color all edges relative to their size. Longer edges will be colored relative to the color defined in the Coloring tab in the top menu. This option allows users to quickly identify which edges are longer, identifying nodes and connections that might be straining the graph.
Graph Manipulations
- Reload Graph: Re-renders the current graph. This option also removes reference nodes and resets SAMMI variables. Use this option in case of unexpected graph behavior.
- Pause Simulation: Pauses the force-directing rendering. Graph rendering is resumed once the graph is clicked.
- Recenter Graph: Returns graph to original zoom level and centers the visualization. Use this option to reset the panning and zooming options.
- Fix Nodes: Fixes all selected nodes. These nodes will no longer be re-arranged in the force-directing, and all floating nodes will be arranged considering its fixed position. Shortcut key f.
- Toggle Fix: Toggles the fixing status of selected nodes. Fixed nodes will become floating and floating nodes will become fixed. To release all selected nodes, first fix them with the options above then toggle their fixing status. Shortcut key t.
- Isolate Reaction: Isolates the selected reaction. This function only works if a single reaction node is selected. An additional copy of each metabolite associated with the selected reaction will be made, and will become the metabolite node associated with the reaction node, isolating the reaction in its own component. See figure below. Shortcut key i if a single reaction node is selected, otherwise this shortcut will refer to the Isolate Metabolite option described below.
- Isolate Metabolite: Works for any set of selected metabolite and reaction nodes. An additional copy of each selected metabolite node will be made, and will become the associated copy of each selected reaction node in which the metabolite takes place. See figure below. Shortcut key i if a single metabolite node or multiple nodes are selected. If a single reaction node is selected this shortcut refers to the Isolate Reaction option above.
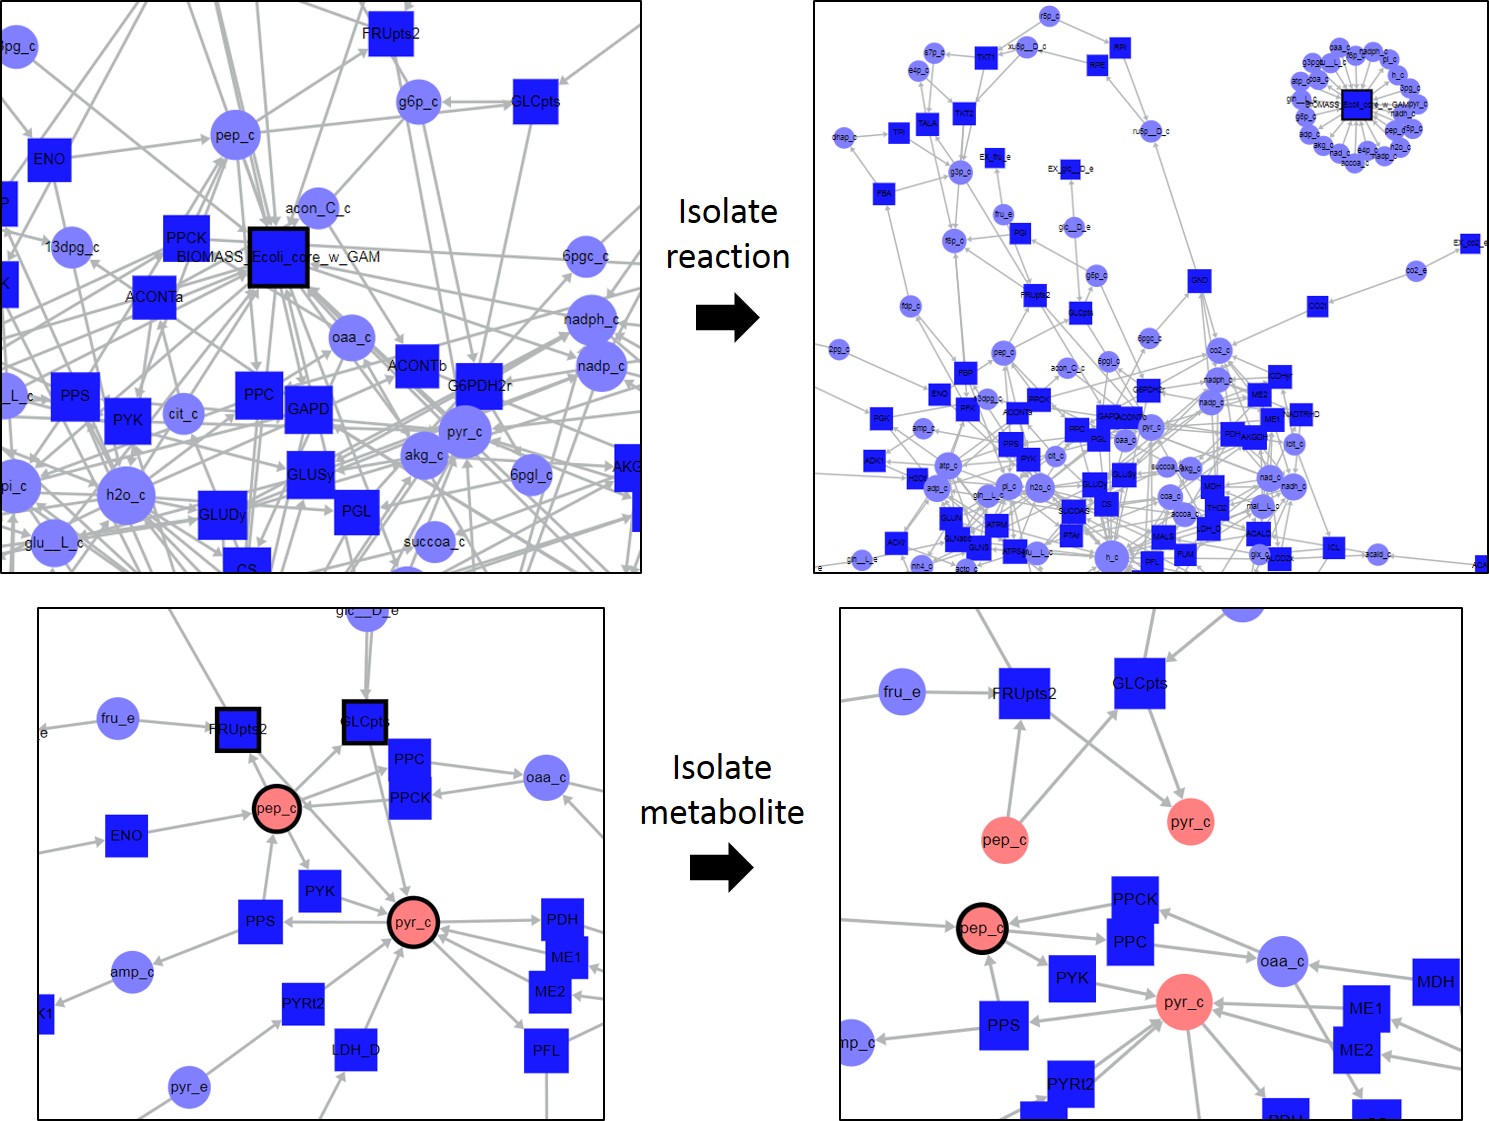
(Top) Isolate Reaction example. The Biomass reaction is connected to multiple metabolites in the map. By isolating the reaction, an additional copy of each metabolite present in the biomass reaction is made, and that copy becomes the copy associated with the Biomass reaction node, isolating the reaction in its own component. (Bottom) Isolate Metabolite example. Metabolites pep_c and pyr_c as well as reactions FRUpts2 and GLCpts are selected. By isolating the metabolites, a second copy of each metabolite is made, and that copy becomes the node associated with the selected reactions. For both isolating functions, all unselected reactions where the copied metabolites take place remain connected to the original metabolite node.
- Select Neighbors: Select all nodes connected to all nodes already selected. shortcut key n.
- Break Metabolite: Makes one copy of all selected metabolites for each reaction the metabolite participates. That is, if a selected metabolite node is connected to five reaction nodes, five copies of the metabolite will be made and connected to each reaction node it participates in. This functionality is meant to split up secondary metabolites such as hydrogen, water, and ATP. Shortcut key b.
- Join Metabolite: Joins into one node all selected metabolites with matching class. For the difference between node id and class please refer to the SAMMI Map Format section of the documentation. For instance, if two glucose metabolites are selected, these will be joined into a single node which will be connected to all reactions connected to the original two glucose nodes. Shortcut key j.
- Shelve Metabolite: Temporarily removes metabolites from the graph. These metabolites can be added back to the map under the Shelved Metabolites subsection of the floating menu described below. Metabolites can also be shelved by uploading a list of regular expressions under the Load Metabolites to Shelve option, or from a standard list of metabolites under the Shelve Standard Metabolites option, both in the Upload/Download tab in the top menu. For more details please refer to the Secondary Metabolites section of the documentation. Shortcut key s.
- Delete Nodes: Remove from the graph selected nodes. Removed nodes cannot be re-introduced, but action can be undone immediately after deletion with the Ctrl + z shortcut. Shortcut key Delete.
- Keep Nodes: Keeps all selected nodes. All unselected nodes are deleted. Removed nodes cannot be re-introduced, but action can be undone immediately after deletion with the Ctrl + z shortcut.
- Make Secondary: Label selected metabolite nodes as secondary. Metabolite nodes must have a degree of one to be marked as secondary. Secondary nodes are drawn smaller and are not drawn to the center of the map, but to a position calculated relative to the substrates and products of the reaction. Shortcut key q if any of the selected metabolite nodes are primary. If all selected metabolite nodes are secondary, this shortcut makes all selected metabolite nodes primary.
- Make Primary: Label selected metabolite nodes as primary. Shortcut key q if all selected metabolite nodes are secondary. Otherwise, this shortcut makes all selected nodes secondary.
- Curve Link: Adds curve to selected node. This function only works if a single node is selected. This function adds a reference node to the graph, which can be dragged to define the curve appearance. All incoming links are aligned in one end of the node and all outgoing links are aligned at the opposite end. While this function works with metabolite nodes, its use is recommended only for reaction nodes. Curving links related to metabolite nodes can overlay arrowheads related to different reaction reversibility. Shortcut key c.
- Delete Curve: Removes curving of links of selected nodes, returning the associated edges to straight lines.
- Auto Curve: Curves the links of selected reaction nodes to a position calculated relative to primary substrate and products related to that reaction. Applies only to reaction nodes. Shortcut key d.
- Group Nodes: Group selected nodes. After grouping, once a node in that group is selected, all remaining nodes in that group are also selected.
- Ungroup Nodes: Remove grouping assignment of selected nodes.
- Collapse: Combines selected reaction nodes into a single node. Selected metabolite nodes are ignored in this function. Metabolites connected only to selected reaction nodes are removed from the graph. For metabolites connected to unselected nodes and multiple selected nodes, only only one edge will be kept. Following this function the editing window will open so the user can rename the resulting node.
- Shortest Path: Selects nodes in the shortest path between consecutively selected nodes. For instance, if nodes A then B then C are selected, this function will select the nodes in the shortest path from A to C passing through B. Shortcut key p.
- Find Long Path: Finds a long path between first two selected nodes. Finding the longest path in a graph is an NP hard problem, so this function does not guarantee the longest path. However, it performs a modified Breadth First Search algorithm which return sequentially longer paths. The algorithm does have a stopping condition, but can also exit once the running time is above the parameter defined in Path Execution Timeout (s) under Settings in the top menu. If nodes A then B then C are selected, for instance, this function will return the longest path between A and B found using the modified algorithm in the given time limit.
- Smallest Circle: Finds the smallest circle between adjacent nodes. Only works if two adjacent nodes are selected. In practice, this function searches for the shortest path between the two selected nodes in a graph where their connected link has been removed.
- Find Component: Selects additional nodes to form a component containing the selected nodes. In practice, this function selected all nodes in pairwise shortest paths, including ties, between the selected nodes.
- Edit Attributes: Opens node attributes in the supporting menu window and allow for editing of such attributes.
- Reverse Reaction: Reverses the directionality of the selected reactions. All substrates become products and all products become substrates. This function is performed independently of reaction directionality, so it is up to the user to select only reversible reactions to maintain feasible reversibility. If the box Reverse Flux is checked, all flux data associated with the selected reaction nodes are also reversed (multiplied by -1). If you wish to reverse the data in some conditions but not other use the Edit Attributes function.
- Pretify Reactions: Organized the selected reactions in a visually pleasing format. Meant to be used only with orphan reaction (reactions defining their own component).
- Untrap Nodes: Removes selected nodes from added shapes. View Text and Shapes subsection below.
Subgraph Manipulations
- Join Subgraphs: This function allows users to join different subgraphs. Once this function is activated, the support menu is opened. A text input field is displayed at the top of the support menu with the name of the current subgraph. This value can be changed to rename the joined subgraph. Select all other subgraphs you wish to join with the current one by clicking their associated checkbox. At the bottom of the window an option to Join similar metabolites is available. If selected, this option will join metabolites of the same class in the resulting subgraph. That is, if pyruvate is present in multiple subgraphs being joined, this option will combine those into a single pyruvate node. If unchecked, the node defined in each subgraph will be displayed separately. Finally, click Join to combine the selected subgraphs with the current one. All nodes from the last joined subgraph will be selected upon joining.
- Rename Subgraph: This function will open the support menu with a text input field. Edit that field and hit Enter to rename the current subgraph.
Search
Type in the text field and press Enter to search for nodes. Nodes matching the search will be selected. If multiple subgraphs are present, the supporting menu will also be displayed showing how many nodes in each other subgraph also match the search. To navigate to a different subgraph, click on that subgraph in the supporting menu. The following options are also available for the search function:
- Focus: If this option is selected, all nodes matching the search and their associated nodes are brought into focus by hiding all remaining nodes. To view all nodes again just click anywhere in the graph. If this box is not checked the nodes matching the search will still be selected but no nodes will be hidden.
- RegExp: Determines whether the search is done by regular expression or not. If checked, the inputed text is taken as a regular expression, otherwise it is simply taken as plain text. If this option is not checked capitalization is not considered.
The Highlight Metabolites option is also available under this subsection. This functionality only works if a single metabolite node is selected. This function loads a temporary graph displaying the selected node, and creates a reaction node for all reaction in which that node participates, appending the subgraph in which that reaction participates to the node name. Nodes are also arranged in a circle with the metabolite node in the center. Drag the reference node to edit the size of the circle and view reaction names clearly. To navigate to a different subgraph double-click the reaction node. To return to the current graph double click on the graph background.
Arranging
This section allows users to arrange the selected nodes in different shapes. All selected nodes are fixed and edges curved according to the desired shape when using these functions. Two options are associated with these arranging function.
- Reverse: Each arranging function organizes the nodes in a certain order. Check this option to reverse this order. For instance, the circle option arranges the nodes in a clockwise order by default. Select this option to arrange the nodes in a counterclockwise order instead.
- Selection Order/Position: If Selection Order is selected, nodes will be arranged in the order in which they were selected. Use this option if you selected the nodes in the desired order, or if the path options were used to select nodes. If Position is selected, nodes will be arranged in an order similar to the one they are in at the beginning of the arranging process. This function might be more suited if nodes are selected using the panning selection or the component function, or if you wish to change the order of arranged nodes.
The available arranging function are:

Arrange selected nodes in a vertical line. Nodes are evenly distributed along the line. Drag the reference node to change the size of the line.

Arrange selected nodes in a horizontal line. Nodes are evenly distributed along the line. Drag the reference node to change the size of the line.

Arrange selected nodes in a diagonal line. Nodes are evenly distributed along the line. Drag the reference node to change the size and angle of the line.

Arrange selected nodes in a circle. Nodes are evenly distributed along the circle. Drag the reference node to change the size and rotation of the circle.

Arrange the selected nodes in a rectangular shape. This function works in two steps. When first activated, nodes will be arranged along a rectangle and a reference node will be added. Drag this reference node to adjust the size of the rectangle. Once this node is dragged it will be reloaded slightly lower and to the right. Next, drag the desired graph nodes along the rectangular shape to the desired location. Nodes can be dragged inside but not outside the rectangular area. When done arranging the nodes, click the reference node to exit this functionality. If you still wish to edit the size of the rectangle use the scale function below.

Rotate, pivot, and scale selected nodes. This function also works in two steps. When first activated, a reference node will be added. Drag this node to define the center of rotation. After dragging this node, a second reference node will be added to the left of the defined center. Drag this second node to rotate and scale the selected nodes around the defined center.
Scale the position of selected nodes. A reference node is added to the bottom right of the selected nodes. Drag this node to scale the position of the selected nodes.
Text and Shapes

This function adds annotation text to the graph. Click this button then on the graph area to add a text box displaying New Text to the graph. To edit this text, double-click the added text and a text input field will be displayed in the support menu for editing. The input text can also be dragged to different locations. Font size can be changed in the Sizing tab in the top menu under Added Text Size.

Rectangular shapes can be added to the graph by clicking this button then clicking on the graph area. A standard sized shape is initially added, but the edges of the rectangle can be dragged to adjust and move the box. By dragging and dropping nodes into the rectangle, nodes can be trapped into the rectangular area. To allow trapped nodes to leave the rectangular shape simply select the node and click on Untrap Nodes under Graph Manipulations in the floating menu, or use the shortcut key u.
Shelved Metabolites
Metabolite nodes can be shelved by using the Shelve Metabolite function under Graph Manipulations, or by uploading a list of regular expressions in the Upload/Download tab in the top menu. All shelved metabolites will be displayed in the dropdown list in this section. Select individual metabolites from the list to return these metabolites to the map. Alternatively, click on Put All Back to reintroduce all shelved metabolites.
Commits
The state of the current graph can be saved by making a commit of the current map. This commit will save the state of all subgraphs. To keep file sizes down, commits are not downloaded in the SAMMI format file. Up to 20 commits can be made of any given graph. If more commits than that are made, the oldest commits are over-written. Node positioning and associated data are saved with every commit, but not graph settings such as force-directing setting, colorscales, and font sizes. To save commits and map settings users can download the current graph in SAMMI format.
To make a commit, type in an optional description of the current state of the map in the Description field and click Commit Current. If this field is left blank, the current date and time will be used as the commit name. The commit is then added to the dropdown menu in this section. To return to a given commit simply select that option in this dropdown menu.
Add Nodes and Edges
Functions in this section allow for the addition of new reaction and metabolite nodes, and for the addition of new connections. The two types of functions in this section are:
- Reaction/Metabolite: To add a new reaction or metabolite, type the name of the desired node in the appropriate field. Both fields will autocomplete with the class of existing nodes. If the inputed name matches the class of an existing node, in any subgraph, that node will be imported to the current graph with all associated data. Reaction nodes are also imported with their associated metabolite nodes. If the name inputed does not match the class of any existing node, in any subgraph, a new node is created and added to the graph with no connections.
- Connect as Substrate/Product: These functions will connect all selected metabolite nodes to all selected reaction nodes as substrates or products accordingly. To use this function select at least one metabolite and one reaction node simultaneously by holding down the Shift key and clicking multiple nodes. Then select whether metabolites are to be added as reaction substrates or products. All selected metabolites will then be connected to all selected reactions as selected. Previously connected nodes will be ignored.