Graph Settings
Several visual and functional graph properties can be changed as desired to alter the graph layout. While many of these functionalities will be covered later in the documentation, this section will highlight some of the standard simulation and visualization options.
Coloring
Node and edge coloring can be changed under the Coloring tab in the top menu. For a full description of these option please refer to the Node and Edge Coloring section of the documentation. Here we will provide a summarized description of some of the option:
- Metabolite: Standard color of floating metabolite nodes with no associated data.
- Reaction: Standard color of floating reaction nodes with no associated data.
- Fixed Metabolite: Standard color of fixed metabolite nodes with no associated data.
- Fixed Reaction: Standard color of fixed reaction nodes with no associated data.
- Edge: Standard color of edges with no associated data.
- Metabolites with size data: Color of metabolite nodes with size data but no color data. If node size data is present, but no color data, setting this option to a different color allows users to identify which nodes are a certain size due to associated data, and which ones are the default node size.
- Reaction with size data: Color of reaction nodes with size data but no color data. Similar to previous option.
- Links with width data: Color of edges with width data but no color data. Similar to previous two options.
- Position node color: Some SAMMI functionalities add a temporary reference node to the graph. This option defines this node color. If users wish to use the default reference node color to color metabolite or reaction nodes, this option can be changed for easy identification of reaction nodes.
- Link Strain Color: The link strain option in the floating menu colors graph edges by their length. This option defines the color of longer edges.
Sizing
Node, edge, and text sizing can be changed under the Sizing tab in the top menu. For a full description of these option please refer to the Node and Edge Sizing section of the documentation. Here we will provide a summarized description of some of the option:
- Label Size: Size of text of node labels.
- Added Text Size: Text annotations can be added to the graph. This option defines the size of the font in these annotations.
- Link Width: Default width of edges with no associated data.
- Node Size: Default size of nodes with no associated data.
- Reference Node Size: Size of reference node. Reference nodes are added for position reference during the execution of some functionalities, such as node positioning and edge curving. If users want to change large areas of the graph, the default node size might be too small to click if the graph is zoomed out. This allows users to increase the size of the reference node.
- Arrow Size: Size of edge arrows.
Settings
Several parameters used in the force-directed graph simulation, as well as other SAMMI functionalities, can be tailored for better visualization and execution purposes. These parameters can be changed under the Settings tab in the top menu. Node labeling can also be changed here using model data.
Link Repulsion Strength: Force-directing layout aims to make each edge a given length defined by this parameter. Higher values will lead to overall longer edges, and lower values to overall smaller edges.
Node Collision Buffer: The graph layout simulation aims to make the nodes not overlap with each other. Setting this value to a positive number will add an additional space between nodes. This will not increase the repulsion between each node, but simply add space between nodes that would otherwise be touching or overlapping.
Node Repulsion Strength: Increase the strength with which nodes repeal each other. Higher values will lead to more spread-out graphs, while lower values will lead to more compact maps.
Inertia: Speed with which the simulation takes place. Lower values will lead the simulation to respond very quickly to node dragging and rearranging, while high value will make the force-directing take place very slowly.
Center Strength: In order for graph components to not drift too far from each other, all nodes are attracted to the center of the graph with a force relative to this parameter. Setting this value to zero will allow any independent components to drift far away from our view, and setting this parameter to high values will bring all nodes to the center of the graph.
Secondary Strength: Metabolite nodes tagged as secondary are not attracted to the center of the graph, but to a point calculated relative to their associated reaction. This parameter defines the strength of this attraction.
Path Execution Timeout (s): One of the options in the floating menu calculates a long path in the graph between two nodes. The calculation of the longest path between two nodes in a graph is an NP hard problem, however. In SAMMI, this long path is calculated by a modified Breadth First Search algorithm that finds increasingly longer paths. While this algorithm does have a stopping condition, it can take an extremely long time to reach it, and it can lead to memory overload in the browser if allowed to run for a long time in large, highly connected graphs. This parameter defines in seconds how long this algorithm can run for. Higher values can return longer paths, but will take longer to run.
Center Size: This option adds a black dot to the center of the graph with size relative to this parameter. This point is added solely for the user’s reference, and does not affect the force directed layout. Make this parameter a positive value to visualize the center point to which nodes are attracted to in the force-directing.
Pretify Size: The pretify option organizes orphan reactions into an aesthetically pleasing format. This option defines the size of the area in which they are organized. Higher values will lead reactions to be arranged in a more spread out manner.
Naming: These options are populated based on data available in the uploaded reconstruction. Changing this option will re-label the nodes in the graph. The search function will search for nodes based on the values in the field defined here. That is, if nodes are labeled by ID, the search function will search the node IDs, if they are labels by name, it will search for names.
Reversibility: Defines how the edge arrows are drawn to indicate reversibility. Reactions are considered reversible if they have a lower bound value of less than zero. Different metabolic reconstructions may use different field names to defined reaction lower bound (e.g. lower_bound or simply lb). To define the field that should be used for reaction lower bound change the value of the LB Field field under the Upload/Download tab.
- None: Indicates no reversibility. Arrows are drawn to indicate the directionality in which the reaction is annotated.
- Both Ways: Draws arrows in both ends of the edges related to reversible reactions. While this option indicates reversibility, it does not indicate the direction in which the reaction is annotated.
- Diamond Arrows: Draws a diamond shape at the target end only of edges related to reversible reactions. This option allows for both the identification of reversibility and directionality of annotation.
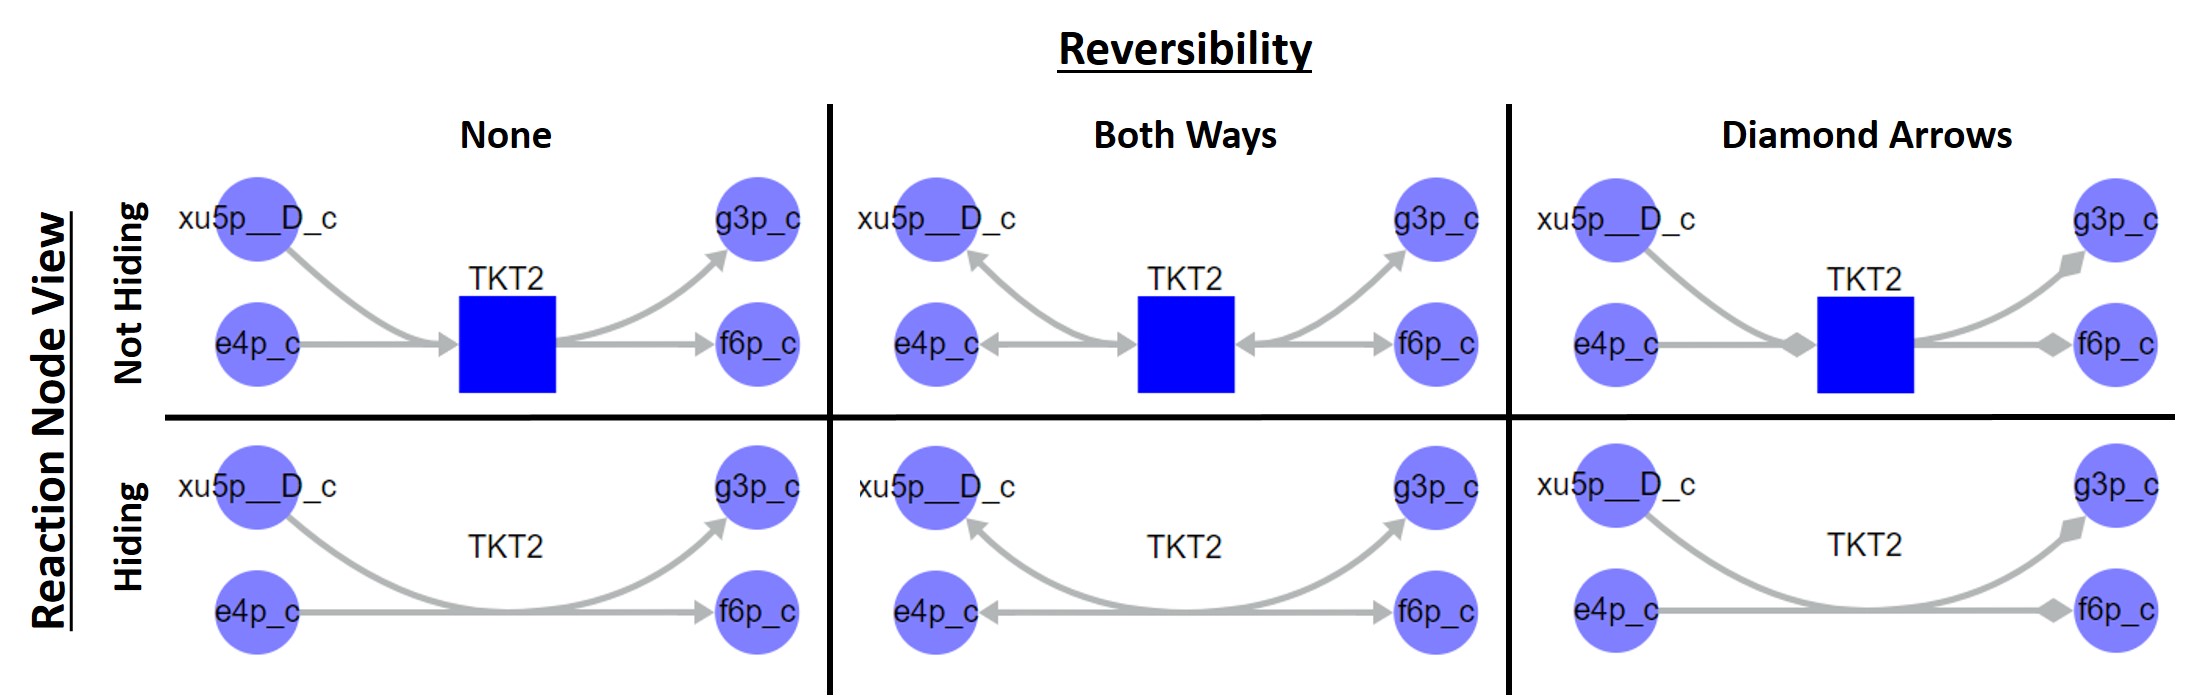
Six reaction visualization formats. Columns indicate the reversibility visualization type, available in the top menu Settings tab, and rows indicate the visualization of reaction nodes, available in the floating menu.
- Node Shape: Defines whether nodes are represented as circles or squares. By default, reactions are usually represented as squares and metabolites as circles in order to easily differentiate between the two node types.